Lasertec Corporation (TSE: 6920): Stock Analysis
Assessing the Disconnect Between Solid Fundamentals and a Sharp Stock Decline
August 14, 2025

1. Introduction
Lasertec Corporation (TSE: 6920) is a leading developer of inspection and measurement equipment for semiconductor manufacturing, with a particular dominance in the field of extreme ultraviolet (EUV) mask inspection systems. Founded in 1960 and headquartered in Yokohama, Japan, Lasertec has carved out a defensible niche at the forefront of semiconductor process control, serving major global foundries and integrated device manufacturers (IDMs).
The company’s unique position stems from its technological leadership in EUV photomask inspection—an essential component for enabling advanced lithography nodes such as 5nm, 3nm, and beyond. In recent years, Lasertec has also expanded its product portfolio into nanoimprint lithography (NIL), advanced packaging inspection, and laser repair systems for compound semiconductors and photonics.
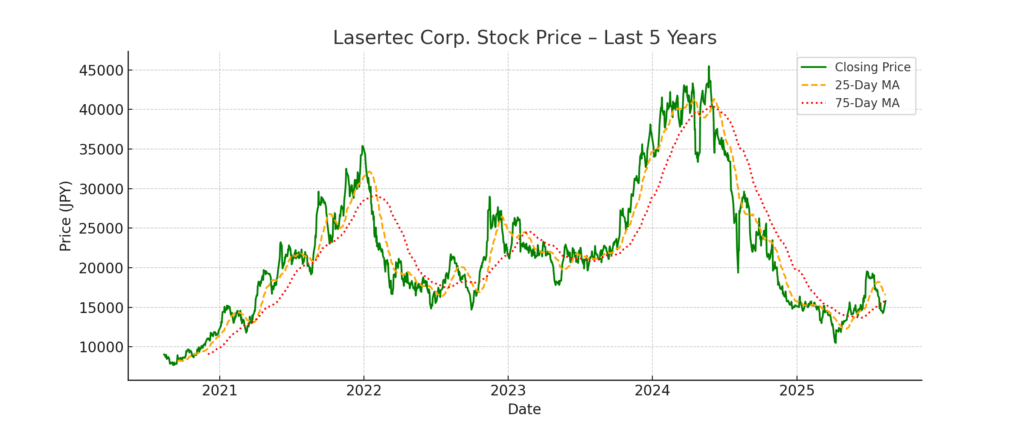
Over the past five years, Lasertec has delivered strong revenue and earnings growth, driven by secular demand for EUV lithography, AI acceleration, and high-performance computing. However, despite this operational momentum, the company’s stock price has declined sharply—falling from an all-time high above ¥40,000 in mid-2024 to the ¥15,000 level as of August 2025.
This sharp decline reflects not only investor concerns about inventory buildup and valuation stretch, but also the reputational impact of a short-seller report in June 2024 alleging accounting irregularities. While subsequent third-party investigations found no misconduct, the episode has fueled ongoing skepticism about governance, working capital management, and disclosure practices.
This report examines whether Lasertec’s long-term growth trajectory remains intact and whether the current share price offers an attractive entry point relative to its fundamentals and strategic positioning.
2. Stock Price Performance
Lasertec’s stock price has experienced notable volatility over the past 18 months. After reaching an all-time high of ¥45,490 on May 15, 2024, the stock entered a steep decline, falling to ¥15,790 as of August 13, 2025—a drop of approximately 65.3% from its peak.
Pre-Correction Rally: A Valuation Bubble?
From mid-2023 through the first half of 2024, Lasertec’s stock soared, fueled by market enthusiasm over AI-related semiconductor demand and strong equipment orders from global foundries. The share price outpaced earnings growth, with the trailing P/E ratio exceeding 70x at its peak. Investors priced in continued dominance in EUV-related systems and aggressive product expansion into NIL and packaging inspection.
Trigger for the Decline: Allegations of Accounting Irregularities
In June 2024, U.S.-based short seller Scorpion Capital published a detailed report accusing Lasertec of inflating revenue and profits via aggressive inventory accounting practices, comparing the company’s financial patterns to historical fraud cases. The report highlighted that Lasertec’s inventory balance increased by 8.7 times over the past five years, while revenue grew by 7.4 times during the same period. This discrepancy raised concerns among investors that the company might be overproducing relative to actual demand, potentially pointing to aggressive revenue recognition practices such as channel stuffing or even fictitious sales.
While Lasertec promptly denied the allegations and commissioned an independent investigation—which concluded in July 2024 with no evidence of fraud—investor confidence was significantly shaken. The stock plunged rapidly in response, and has not meaningfully recovered despite the company’s efforts to restore trust.
Current Sentiment and Technical Indicators
As of August 2025:
Share Price: ¥15,790
52-week high / low: ¥45,490 / ¥15,560
Trailing P/E: ~16.8x (FY2025 EPS: ¥938.61)
P/B Ratio: ~6.8x (BPS: ¥2,327.06)
Dividend Yield: ~2.1%
Despite record-high earnings and solid demand for EUV and NIL systems, investor sentiment remains cautious. The sharp drop from ¥45,490 to current levels reflects a loss of confidence, primarily due to concerns around inventory build-up, governance practices, and reputational impact from short-seller allegations.
While valuation metrics have corrected—especially P/E—the elevated P/B ratio signals the market still expects structural growth, albeit with greater scrutiny.
3. Financial and Operational Performance
3.1 Revenue and Profit Growth
Lasertec has delivered remarkable top-line growth over the past five fiscal years:
| Fiscal Year | Revenue (JPY mm) | Operating Profit (JPY mm) | Net Profit (JPY mm) | EPS (JPY) | Dividend (JPY) |
|---|---|---|---|---|---|
| FY2021 | 70,248 | 26,074 | 19,250 | 213.47 | 75 |
| FY2022 | 90,378 | 32,492 | 24,850 | 275.57 | 97 |
| FY2023 | 152,832 | 62,287 | 46,164 | 511.89 | 180 |
| FY2024 | 213,506 | 81,375 | 59,076 | 655.05 | 230 |
| FY2025 | 251,477 | 122,843 | 84,652 | 938.61 | 329 |
Key observations:
Revenue growth accelerated dramatically from FY2022 onward, with a CAGR exceeding 38% over five years.
Operating profit margin also expanded significantly, rising from 37.1% in FY2021 to 48.9% in FY2025.
Net profit more than quadrupled over the five-year span, demonstrating strong scalability and efficiency.
EPS (Earnings per Share) grew robustly from ¥213.47 to ¥938.61, supporting increasing shareholder returns.
Dividend per share rose steadily, with a FY2025 payout of ¥329 — over 4x the FY2021 level — indicating a strong shareholder return policy and confidence in cash generation.
3.2 Business Drivers and Cost Structure
According to Lasertec’s securities filings and FY2025 investor materials:
Sales of advanced mask inspection systems (especially for EUV and NIL) continued to expand amid strong capital expenditures by major semiconductor foundries.
The company noted accelerating demand in NIL-related equipment driven by 2nm generation logic chips.
Service and maintenance revenues also rose, benefiting from the installed base expansion and high operating rates among customers.
On the cost side, Lasertec cited:
Economies of scale in procurement and manufacturing.
Continued investment in R&D and skilled engineering resources.
Strategic inventory buildup and robust supply chain management, helping avoid delivery delays.
3.3 Recent Momentum and Strategic Themes
In FY2025, several structural and cyclical factors converged to support performance:
Lasertec’s early-mover advantage in EUV-related inspection tools solidified its competitive moat.
Strategic focus on vertical integration and modular platform architecture enhanced product competitiveness.
Demand from leading-edge nodes (3nm and 2nm) provided a secular tailwind.
Capex by key clients remained strong despite cyclical uncertainties, leading to order backlogs and steady revenue recognition.
Nonetheless, the company also acknowledged growing challenges:
R&D costs are expected to rise due to diversification into NIL and advanced packaging applications.
Capital investment plans remain high, which may moderate free cash flow in the near term.
The company emphasized its intent to maintain high ROE and profitability through innovation-driven growth and global talent acquisition.
4. Business Segments and Strategic Positioning
4.1 Overview of Lasertec’s Business Segments
Lasertec Corporation operates as a specialized manufacturer of semiconductor-related inspection and measurement equipment. Its primary revenue sources can be categorized into three core business segments:
| Segment | Description | FY2025 Trends |
|---|---|---|
| EUV Mask Inspection Equipment | Inspection tools for masks used in EUV lithography. | Continued dominance; robust demand from Tier-1 foundries. |
| Photomask and Mask Blank Inspection | Tools for conventional and next-gen photomasks and mask blanks. | Stable demand; used in both logic and memory device production. |
| NIL-related and Packaging Equipment | New systems for Nanoimprint Lithography (NIL) and advanced packaging. | High growth potential; expansion beyond EUV domain. |
These product lines are largely customized and high-margin, supported by Lasertec’s deep expertise in optical systems and proprietary image processing software. The company does not operate in commoditized segments like mainstream front-end metrology or etching.
4.2 Strategic Positioning in the Global Semiconductor Ecosystem
Lasertec holds a unique global position as the sole supplier of EUV mask inspection systems — a critical bottleneck technology for advanced node semiconductor manufacturing. Its strategic advantages include:
Technological Leadership:
Lasertec was first-to-market with EUV mask inspection systems and continues to lead in inspection resolution and throughput.
The company maintains a competitive edge via continuous R&D investment, representing over 12% of revenue in FY2025.
Customer Entrenchment:
Major global foundries (such as TSMC, Samsung, and Intel) rely on Lasertec’s equipment for production at 5nm, 3nm, and emerging 2nm nodes.
Once installed, switching costs are extremely high due to integration with production processes and reliance on Lasertec’s software updates and maintenance.
IP and Platform Strength:
Its core inspection platforms (ACTIS series, MATRICS series) are modular and upgradable — enabling customers to extend tool life and performance.
Lasertec’s proprietary software and algorithm libraries serve as high-barrier IP assets that are difficult to replicate.
4.3 New Growth Vectors: NIL and Packaging
In addition to EUV, Lasertec is aggressively investing in growth areas that address future semiconductor scaling limitations:
Nanoimprint Lithography (NIL):
NIL is emerging as a complementary or alternative solution to EUV for sub-2nm patterning.
Lasertec is developing NIL defect inspection tools targeting logic manufacturers adopting NIL for interconnect layers.
Advanced Packaging Inspection:
As chiplet and 3D packaging architectures gain traction, demand for high-precision inspection of package substrates and interposers is rising.
Lasertec’s entry into this domain enhances its long-term relevance beyond wafer-level front-end.
These initiatives broaden Lasertec’s total addressable market (TAM) and reduce future dependence on a single lithography technology.
4.4 Geographic and Strategic Expansion
Global Customer Base:
Over 90% of Lasertec’s revenue is derived from overseas clients, particularly leading-edge foundries and IDMs in Taiwan, South Korea, the U.S., and Europe.
Capacity Expansion and Talent Investment:
The company continues to expand its R&D and production facilities in Japan to support growing order volumes.
It has ramped up hiring of engineers, optics specialists, and software developers — critical to sustaining innovation.
5. Growth Drivers and Catalysts
Despite its recent stock price correction, Lasertec retains several structural growth drivers that continue to underpin its long-term investment thesis. However, confidence-sensitive catalysts will be key in reversing market skepticism and driving a sustainable re-rating.
5.1 Dominance in EUV Mask Inspection
Lasertec remains the sole commercial supplier of EUV photomask inspection equipment globally—a position reinforced by its strong ties to ASML and key logic foundries such as TSMC, Intel, and Samsung. As the industry migrates toward 2nm and below nodes, defect inspection requirements become increasingly stringent, providing recurring demand for Lasertec’s platforms.
Catalyst: Adoption of next-gen High-NA EUV technology and 3D stacking will increase inspection complexity, creating new system sales and service revenue opportunities.
5.2 Expansion into NIL and Packaging Markets
The company is actively diversifying into nanoimprint lithography (NIL) and advanced packaging inspection, targeting growth areas in DRAM, CMOS image sensors, and heterogeneous integration.
NIL Segment: Poised to benefit from Canon’s NIL push, especially in applications where EUV is cost-prohibitive.
Packaging Inspection: Leverages Lasertec’s metrology and imaging capabilities to serve the chiplet and 2.5D/3D integration trend.
Catalyst: Commercial deployment of NIL-based mass production lines and broader adoption of advanced packaging nodes (e.g., Foveros, CoWoS).
5.3 New Products and Technological Evolution
Lasertec continues to invest aggressively in R&D, with an R&D expense of ¥18.8 billion in FY2025 (14.2% of revenue). The pipeline includes new inspection platforms for photonics, compound semiconductors, and micro-LEDs, enabling long-term revenue diversification.
Catalyst: Successful ramp-up of these new platforms with Tier-1 clients could validate Lasertec’s technological adaptability beyond EUV.
5.4 Strong Backlog and Profitability
As of June 2025, Lasertec maintains a robust order backlog of ¥116.3 billion, providing near-term revenue visibility. Despite margin pressures, the company’s operating profit margin remains over 30%, demonstrating continued cost discipline and pricing power.
Catalyst: Conversion of backlog into revenue amid macro headwinds could support earnings stability and rebuild investor trust.
5.5 Sentiment Recovery Post-Scandal
While the June 2024 short-seller report triggered intense scrutiny, the independent audit found no accounting misconduct. With financial transparency efforts ongoing, Lasertec has the opportunity to regain credibility through consistent disclosures and conservative inventory management.
Catalyst: Clear improvement in inventory turnover ratio and cash conversion cycle (CCC) could signal healthy operational dynamics and reassure institutional investors.
6. Risks and Challenges
Despite Lasertec’s technological strength and growing end-markets, the company faces several material risks that could hinder investor confidence, operational performance, or long-term strategic execution.
6.1 Reputational Risk from Accounting Allegations
Although Lasertec was cleared by a third-party review following the June 2024 short-seller allegations, the episode has introduced lasting reputational damage. The rapid share price collapse suggests that many institutional investors still harbor concerns regarding governance, transparency, and accounting conservatism.
Challenge: Rebuilding trust through more granular disclosure on inventory accounting, revenue recognition policies, and internal controls will be critical.
Residual Risk: A future discrepancy in financial reporting—even if unintentional—could amplify skepticism.
6.2 High Inventory Accumulation
Lasertec’s inventory has grown disproportionately faster than revenue over the past five years, reaching ¥94.7 billion in FY2025 (vs. ¥11.3 billion in FY2020). This raises questions about potential overproduction, customer pushouts, or overly optimistic demand assumptions.
Risk: Inventory write-downs or working capital drag may materialize if orders are delayed or canceled.
Operational Implication: Capital inefficiency could pressure cash flows and reduce financial agility.
6.3 Customer Concentration
A significant portion of Lasertec’s revenue depends on a small number of Tier-1 foundries (notably TSMC and Samsung). A strategic shift in lithography technology, budget allocations, or supply chain partnerships could have a direct revenue impact.
Risk: Delays in EUV expansion or shifts toward alternative metrology vendors could reduce equipment orders.
6.4 Valuation Fragility Amid Market Volatility
As of August 2025, Lasertec trades at approximately 16× P/E based on FY2025 earnings, significantly down from the peak valuation of over 60× during mid-2024. This compression reflects both a cooling of growth expectations and lingering concerns over governance and inventory management.
Market Sensitivity: Lasertec is a high-beta stock, susceptible to global semiconductor capex cycles, U.S.–China tensions, and interest rate volatility.
6.5 Talent and Capacity Constraints
With R&D and production in Japan, Lasertec faces domestic labor shortages, rising technical salary costs, and capacity scaling challenges. Its ability to execute rapid expansion amid strong demand may be hampered by these structural bottlenecks.
7. Conclusion
Lasertec stands at a crossroads. On one hand, it maintains a near-monopolistic edge in EUV photomask inspection, has made inroads into NIL and advanced packaging, and continues to benefit from long-term demand for cutting-edge semiconductor technologies. On the other hand, the company is managing the aftermath of reputational challenges, inventory build-up, and growing investor skepticism.
Valuation Snapshot (as of August 13, 2025)
Share Price: ¥15,790
EPS (FY2025): ¥938.61
BPS (FY2025): ¥2,327.06
P/E Ratio: ~16.8x
P/B Ratio: ~6.8x
Dividend Yield: ~2.1%
While the P/E ratio has reverted to more normalized levels, the P/B ratio remains elevated, suggesting that the market continues to assign a premium to Lasertec’s long-term growth potential and technological leadership. However, the sharp disconnect between its steadily rising revenue and falling stock price points to non-financial concerns—particularly governance transparency, working capital discipline, and trust in management disclosures.
The fallout from the June 2024 short-seller report, which highlighted disproportionate inventory growth relative to sales, continues to linger—even after an independent audit found no evidence of fraud. Investor sentiment remains fragile, especially in light of the broader semiconductor cycle correction and macro headwinds.
Investment Verdict
Rating: HOLD (Cautiously Neutral)
At the current price, Lasertec appears fairly valued relative to earnings, but skepticism over governance and capital efficiency continues to weigh on the stock. A clear rerating will likely require tangible improvements in disclosure, inventory management, and success in new product commercialization.
Upside Triggers
Acceleration in EUV High-NA adoption
Sustained >30% operating margins
Improved transparency and investor relations
Commercial breakthroughs in NIL and packaging segments
Downside Watchpoints
Inventory write-downs or extended correction in demand
Competitive erosion or strategic execution failure
Renewed governance concerns or short-seller activism
At Wasabi Info, we publish concise equity reports and market insights through our blog—
but our core value lies in providing bespoke, on-demand research for international clients.
Whether you are a private investor or a corporation, we deliver confidential, tailored intelligence designed to support strategic decisions.
Our research services include:
• Equities: In-depth analysis of Japan-listed companies not featured in the blog
• Competitor Analysis: Detailed mapping of industry rivals and market dynamics
• Market Entry Intelligence: Insights into local barriers, regulations, and competitor positioning
• Real Estate & Assets: Localized assessments for factory, hotel, or retail expansion
• Field Intelligence: On-the-ground surveys and discreet market checks unavailable through public sources
Reports are available in English, Chinese, and Japanese.
For inquiries, please contact: admin@wasabi-info.com
© Wasabi Info | Privacy Policy
Disclaimer
This report is intended for informational purposes only and does not constitute investment advice. The analysis contains forward-looking statements and interpretations based on publicly available information as of the date of writing. Readers should conduct their own research and consult with a licensed financial advisor before making any investment decisions.
Wasabi-Info.com shall not be held liable for any loss or damage arising from the use of this report or reliance on its contents.


