

Honeys Holdings Co., Ltd. (TSE: 2792) – Stock Price Trend, Strategy, and Outlook
1. Stock Performance and Financial Context
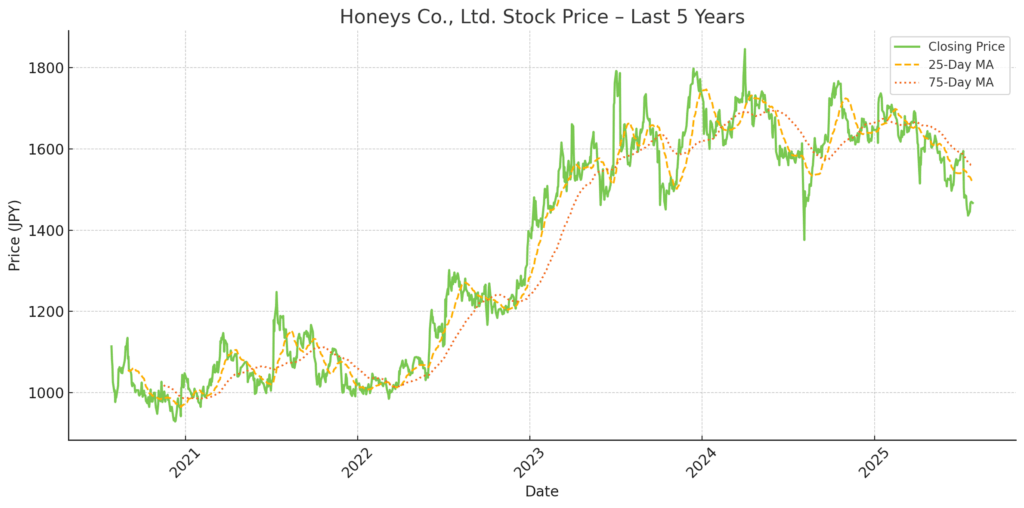
Honeys Holdings Co., Ltd. (TSE: 2792) has exhibited relatively steady revenue growth over the past five fiscal years, supported by its vertically integrated business model. However, the company’s recent earnings trend shows signs of pressure, reflecting macro headwinds and internal cost burdens.
As of July 28, 2025, the stock trades at approximately ¥1,467, down from a 52-week high of ¥1,785. The decline corresponds with falling net income in FY2025 and concerns around operating margin compression.
FY2025 Revenue: ¥57.7 billion (+2.0% YoY)
FY2025 Operating Profit: ¥5.9 billion (–15.3% YoY)
FY2025 Net Profit: ¥3.7 billion (–23.5% YoY)
EPS (Trailing): ¥175.0 → Forward estimate: ~¥130–140
Dividend (Projected): ¥55 per share (3.7% yield)
P/E (Forward): ~7.7x
Despite top-line growth, earnings momentum has weakened due to rising raw material and personnel costs, as well as increased promotional expenses.
2. Key Drivers of FY2025 Profit Decline
While FY2024 was marked by record-high operating and net profits, FY2025 saw a notable decline in profitability despite higher revenue. The main factors include:
Cost-Related Pressures:
Rising Labor & Fuel Costs: Myanmar factory wage inflation and domestic personnel costs added structural burden.
SG&A Expenses: Up 4.1% YoY, driven by advertising, logistics, and store-related costs.
Gross Profit Margin: Declined to 59.2% (–1.1pp YoY) due to aggressive inventory liquidation and cost inflation.
Mild Spring/Summer Season:
While summer and autumn collections performed well, spring/early-summer lines underperformed due to cooler-than-expected weather, resulting in a higher reliance on markdowns.
3. Strategic Developments
E-Commerce Expansion
EC sales grew by 14.3% YoY to ¥7.1 billion.
EC now accounts for 12.1% of total sales (up from 10.8%).
Strong traction for character collaborations and online-only product lines.
Focus on:
Website UI/UX enhancements
Marketing automation (MA tools)
Social media and web ad integration
“Click & Collect” model (store pickup from EC)
Myanmar Operations
Workforce increased to 5,335 as of May 2025 (+787 YoY).
Honeys’ third factory continues progressing toward full-scale operations.
Management maintained stable output despite political and cost headwinds.
Sourcing consolidation and idle-season production are used to optimize per-unit cost.
4. Financial Strength and Cash Flow
| Fiscal Year End | Revenue (¥B) | Net Profit (¥B) | Equity Ratio | Net Cash |
|---|---|---|---|---|
| 2023/5 | 54.9 | 5.34 | 81.3% | Strong |
| 2024/5 | 56.6 | 4.88 | 84.8% | Strong |
| 2025/5 | 57.7 | 3.73 | – | Strong |
Honeys maintains zero interest-bearing debt.
Cash & equivalents: ¥12.8B as of May 2025.
Free cash flow remains solid despite moderate decline in operating income.
5. Business Model and Competitive Advantage
SPA Model (Specialty store retailer of Private-label Apparel)
Controls the entire chain from product planning, production, logistics, and retail.
Offers affordable fashion with high turnover.
Product categories include casual wear, career fashion, and accessories targeting women in their 10s to 50s.
Store Network
Approximately 900 stores across Japan (as of 2025), predominantly in suburban shopping malls and stations.
Compact store format and regional expansion allow for flexible deployment and lower fixed cost per unit area.
Vertical Supply Chain
ASEAN production base enables high cost control.
Low inventory risk due to controlled lead times and limited seasonal exposure.
6. Risks and Challenges
| Category | Description |
|---|---|
| Cost Inflation | Labor cost inflation in Myanmar and Japan; raw material and fuel volatility |
| Geopolitical Dependence | Heavy reliance on Myanmar production (political & ESG risks) |
| Competitive Landscape | Intense price competition in fashion retail & EC platforms |
| Brand Differentiation | Challenges in sustaining youth appeal vs fast-changing trends |
| Weather Sensitivity | Product sell-through relies on temperature trends |
| ESG & Supply Chain Risk | Human rights & traceability scrutiny may rise |
7. Current Valuation and Market Sentiment
| Metric | Value | Interpretation |
|---|---|---|
| P/E (TTM) | ~8.3× | Modestly undervalued |
| Forward P/E | ~7.7× | Indicates earnings pessimism |
| P/B Ratio | ~0.9× | Priced below book value |
| Dividend Yield | ~3.7% | Relatively attractive |
| Price/Sales | ~0.7× | Low for fashion retail |
While short-term sentiment remains cautious due to profit compression, the current valuation implies limited downside risk, especially for long-term income-focused investors.
8. Outlook and Investment Consideration
Despite temporary headwinds in FY2025, Honeys continues to benefit from a solid financial base and scalable production infrastructure. The company’s conservative management style and consistent dividend payments provide a strong backstop for downside protection.
Catalysts
Margin recovery in FY2026 through optimized sourcing and cost controls.
Acceleration in EC contribution via mobile-first strategy.
Store renewal and brand repositioning to boost customer engagement.
Risks to Monitor
Further deterioration in Myanmar’s operational environment.
Inability to offset wage and logistics cost increases.
Missed fashion trends or failure to attract younger demographics.
9. Summary
| Strengths | Weaknesses |
|---|---|
| Strong balance sheet (debt-free) | Profit pressure in FY2025 |
| Dividend continuity & stability | Myanmar reliance |
| Integrated SPA model | Brand repositioning needed |
| Expanding EC channel | Limited overseas presence |
Investment Thesis:
Honeys offers a low-risk, conservative exposure to the Japanese domestic apparel market with a growing EC strategy. At current levels, it represents a defensive holding with income upside. However, medium-term re-rating will depend on margin recovery and digital transformation execution.
Disclaimer
This report is intended for informational purposes only and does not constitute investment advice. The analysis contains forward-looking statements and interpretations based on publicly available information as of the date of writing. Readers should conduct their own research and consult with a licensed financial advisor before making any investment decisions.
Wasabi-info.com shall not be held liable for any loss or damage arising from the use of this report or reliance on its contents.
At Wasabi Info, we publish concise equity reports and market insights through our blog—
but our core value lies in providing bespoke, on-demand research for international clients.
Whether you are a private investor or a corporation, we deliver confidential, tailored intelligence designed to support strategic decisions.
Our research services include:
• Equities: In-depth analysis of Japan-listed companies not featured in the blog
• Competitor Analysis: Detailed mapping of industry rivals and market dynamics
• Market Entry Intelligence: Insights into local barriers, regulations, and competitor positioning
• Real Estate & Assets: Localized assessments for factory, hotel, or retail expansion
• Field Intelligence: On-the-ground surveys and discreet market checks unavailable through public sources
Reports are available in English, Chinese, and Japanese.
For inquiries, please contact: admin@wasabi-info.com
© Wasabi Info | Privacy Policy