
Sumitomo Realty & Development Co., Ltd. (TSE: 8830): Stock Analysis
September 13, 2025
1. Introduction
Sumitomo Realty & Development Co., Ltd. (“Sumitomo Realty”) is one of Japan’s largest integrated real estate developers and a core member of the Sumitomo Group. Founded in 1949 and headquartered in Tokyo, the company operates across four major segments:
Real Estate Leasing – development and operation of office buildings, high-end rental residences, hotels, event halls, and commercial facilities.
Real Estate Sales – condominiums, detached housing, and land for development.
Construction and Renovation – including the flagship “Shinchiku Sokkurisan” rebuilding and custom-built housing.
Real Estate Brokerage and Services – through its wholly owned subsidiary, Sumitomo Real Estate Step Co., Ltd.
The company’s business model emphasizes long-term retention of prime Tokyo office properties, enabling stable rental income and defensive earnings. At the same time, it maintains a strong presence in the condominium development market, consistently ranking among Japan’s top suppliers. Recently, Sumitomo Realty has expanded internationally, with strategic projects in Mumbai, India, aimed at securing long-term growth.
2. Stock Price Performance
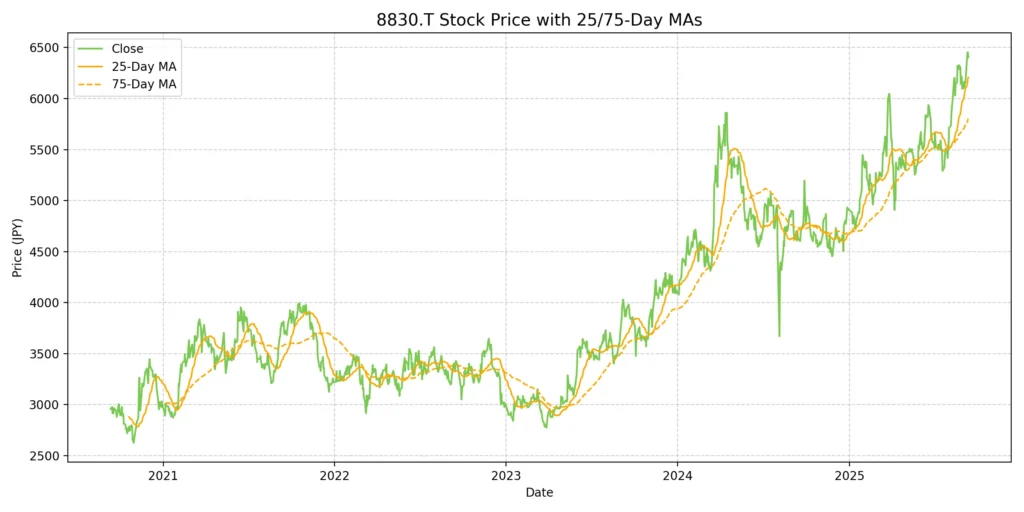
Current Share Price (as of September 12, 2025): ¥6,440
52-week Range: ¥3,692 – ¥6,358
Market Capitalization: ~¥3.0 trillion
Shares Outstanding: ~468 million
Sumitomo Realty’s share price has more than recovered from its 2024 trough, driven by robust office leasing performance, strong condominium demand, and expectations for medium-term earnings growth. The rally from ¥3,700 to over ¥6,300 highlights renewed investor confidence in the resilience of Tokyo’s real estate market.
At the current level, the stock trades at a P/E of ~15.9x FY2025 EPS (¥405.1) and a P/B of ~1.4x (book value per share ¥4,606). Dividend yield remains modest at ~1.1% (¥70 DPS in FY2025), reflecting management’s conservative payout policy.
3. Financial and Operational Performance
Key Consolidated Financials (FY2023–FY2025)
| Fiscal Year | Revenue (¥ bn) | Operating Profit (¥ bn) | Net Income (¥ bn) | EPS (¥) | DPS (¥) | Equity Ratio (%) | ROE (%) |
|---|---|---|---|---|---|---|---|
| FY2023 | 940.0 | 241.3 | 161.9 | 341.7 | 52 | 28.3 | 9.4 |
| FY2024 | 967.7 | 254.7 | 177.2 | 373.8 | 60 | 30.7 | 9.2 |
| FY2025 | 1,014.2 | 271.5 | 191.7 | 405.1 | 70 | 32.3 | 9.1 |
Revenue growth: Sales expanded from ¥940bn (FY2023) to over ¥1,014bn (FY2025), representing a +7.8% increase across three years. The leasing business was the key driver, supported by rental growth in central Tokyo.
Profitability: Operating profit rose steadily (¥241.3bn → ¥271.5bn), with operating margin improving from 25.7% to 26.8%. Net income increased by ~18% over the period, underscoring resilient earnings quality.
Balance sheet: Equity ratio improved from 28.3% to 32.3%, highlighting stronger financial stability.
Shareholder returns: Dividends per share grew consistently from ¥52 to ¥70 (+35% in three years). Payout ratio remains conservative (~17%), leaving headroom for reinvestment.
Overall: Sumitomo Realty delivered steady top-line expansion, stronger margins, and disciplined capital allocation over the past three years, aligning with management’s medium-term plan targeting further profit growth.
4. Business Segments and Strategic Positioning
Real Estate Leasing (Core Earnings Driver)
Overview: Leasing is the largest contributor, accounting for ~70% of operating profit. The portfolio includes over 230 buildings in central Tokyo (approx. 1.85 million tsubo / 6.1m m² of floor area).
Performance: In FY2025, leasing revenue exceeded ¥444bn, with operating profit around ¥177bn. Vacancy rates in existing buildings improved to 5.7%, reflecting strong tenant demand and limited prime supply.
Drivers:
Rent increases in core submarkets (Shinjuku, Roppongi, Marunouchi fringe).
Contribution from new properties such as Tokyo Mita Garden Tower and Shinjuku South Exit Building.
Recovery in hospitality-related leasing (hotels, event halls) post-pandemic.
Strategic Position: Sumitomo’s strategy differs from peers: it retains rather than recycles assets, securing recurring rental income and long-term resilience. This provides stability but moderates ROE relative to Mitsui or Mitsubishi.
Real Estate Sales (Condominiums, Detached Homes, Land)
Overview: Sumitomo is among Japan’s largest condominium suppliers, consistently ranking in the top three nationwide. Sales include condominiums, detached homes, and residential land parcels.
Performance: FY2025 sales reached ~¥240bn, with operating profit ~¥60bn. Around 5,000 units were delivered annually, supported by a six-year secured land bank.
Drivers:
High demand sustained despite rising construction costs, underpinned by urban population concentration.
Pre-sold projects with construction costs already locked in mitigate margin pressure.
Premium developments (e.g., City Tower Toranomon, Grand City Tower Ikebukuro) strengthen brand positioning.
Challenges: Affordability risk remains if condominium prices continue rising faster than wages. However, Sumitomo’s early land acquisitions provide pricing flexibility.
Construction and Renovation (“Shinchiku Sokkurisan” & Custom Homes)
Overview: A unique segment among major developers, centered on the “Shinchiku Sokkurisan” brand (large-scale rebuilding) and custom homes under Sumitomo Real Estate Housing.
Performance: FY2025 revenue exceeded ¥205bn, with operating profit ~¥21bn. Although smaller than leasing and sales, it provides stable cash flow.
Drivers:
Japan’s aging housing stock (~40 years average age) underpins structural demand for large-scale renovations.
Brand recognition and nationwide network give Sumitomo a competitive edge.
Integration with custom housing business enhances scale and procurement efficiency.
Strategic Position: Serves as a consumer-facing differentiator versus Mitsui and Mitsubishi, which have limited exposure to renovation markets.
Brokerage and Others (Sumitomo Real Estate Step & Related Businesses)
Overview: Brokerage operations focus on existing housing transactions, complemented by fitness clubs, insurance agency, restaurants, and facility management.
Performance: FY2025 revenue ~¥72bn, operating profit ~¥22bn. While relatively small, it enhances group synergies and brand reach.
Drivers:
Aging population and government promotion of existing housing circulation support long-term brokerage growth.
High transaction volumes give Sumitomo a top position in the brokerage market.
Strategic Position: Complements development businesses, enabling full value-chain coverage from development to secondary transactions.
Overall Strategic Positioning
Tokyo-centric stability: Leasing provides a stable earnings base anchored in the Tokyo office market, the company’s clear differentiator.
Consumer-facing depth: Condominium development, renovation, and brokerage give Sumitomo stronger exposure to end-user demand than Mitsui or Mitsubishi.
Balanced growth model: While less internationally diversified, the combination of leasing stability and housing-related growth positions Sumitomo as a defensive yet moderately growing developer.
Forward-looking expansion: Mumbai projects represent a step toward geographic diversification, though still at an early stage.
5. Investment Outlook and Catalysts
Tokyo office leasing tailwinds
The vacancy rate declined from 5.8% at the end of FY2024 to 5.7% in 1Q FY2026.
Rental repricing is gaining traction amid limited new supply in prime areas.
Flagship projects like Roppongi Central Tower and Shinjuku South Exit Building are expected to lift rental revenues further.
Condominium pipeline resilience
Despite construction cost inflation, all projects scheduled for FY2026 are already locked-in with fixed costs.
With six years’ worth of land secured, management can maintain volume without aggressive land acquisitions, reducing exposure to overheated bidding.
International expansion in Mumbai
Large-scale mixed-use projects in Worli and BKC districts.
Revenue contribution expected to start in FY2026, with full-scale profit impact in the 2030s.
Provides geographic diversification and a hedge against Japan’s demographic stagnation.
Urban redevelopment as structural growth driver
Strategic role in transforming aging urban areas (e.g., Roppongi 5-chome, Yaesu South) ensures sustained pipeline.
These projects not only support financial growth but enhance the company’s ESG positioning through disaster resilience and community renewal.
Shareholder return policy acceleration
Commitment to ¥100 DPS by FY2028, achieved via steady profit growth and payout expansion.
Cross-shareholding reduction continues, unlocking capital for reinvestment and shareholder returns.
6. Risks
Concentration in Tokyo metropolitan area
While the Tokyo office market provides stability, it also increases exposure to localized shocks (earthquake risk, tenant migration, or sudden oversupply).
Execution risk in large-scale redevelopments
Projects like Roppongi 5-chome are multi-year, complex redevelopments involving many stakeholders. Any delay in approvals, cost escalation, or slower-than-expected tenant absorption could weigh on returns.
Condominium affordability ceiling
Although sales remain robust, rising unit prices may test affordability limits, especially if wage growth lags. If absorption rates slow, profit margins could be pressured despite secured land bank.
International expansion risk
Mumbai projects introduce exposure to foreign regulatory, legal, and political environments. Execution delays, currency volatility, or policy shifts could reduce expected returns.
Policy stock reduction and capital allocation
The accelerated sale of cross-shareholdings could expose near-term earnings volatility. Reinvestment discipline will be critical to avoid diluting returns.
7. Competitive Positioning: Strategies, Strengths & Weaknesses vs. Peers
1. Mitsui Fudosan (8801)
Strategy: Diversified growth model balancing domestic leasing with overseas expansion (U.S., U.K., Asia). Operates J-REIT platforms to recycle assets and enhance ROE.
Strengths: Largest scale (~¥2.5tn revenue), strong global footprint, higher ROE (~10–11%).
Weaknesses: Higher reliance on asset sales introduces volatility; greater FX and geopolitical exposure.
2. Mitsubishi Estate (8802)
Strategy: Premium office-focused, anchored in Marunouchi, with selective overseas diversification (London, New York, Shanghai). Strong ESG integration.
Strengths: Prestigious Marunouchi portfolio, blue-chip tenant base, balanced global exposure.
Weaknesses: Still office-heavy, less residential exposure; moderate ROE (~9–10%).
3. Sumitomo Realty & Development (8830)
Strategy: Tokyo-focused “hold-and-operate” model, retaining prime assets for recurring income; strong residential & renovation presence; new overseas expansion in Mumbai.
Strengths: Stable recurring rental income, consumer brand leadership in housing, conservative balance sheet, steady DPS growth.
Weaknesses: Limited overseas presence, lower dividend yield (~1.1%), ROE (~9%) below Mitsui due to capital-heavy model.
Comparative Assessment
Scale & Diversification: Mitsui leads in scale and global reach; Mitsubishi dominates premium offices; Sumitomo focuses on Tokyo-centric stability.
Capital Strategy: Mitsui/Mitsubishi employ asset recycling; Sumitomo emphasizes ownership stability.
Residential Exposure: Sumitomo is stronger in consumer-facing housing and renovation.
Shareholder Returns: Mitsui offers the highest yield, Sumitomo the lowest but with clear growth trajectory.
International Exposure: Sumitomo lags peers but Mumbai projects mark a strategic shift.
Summary:
Sumitomo Realty offers a “Tokyo fortress” model of stability and recurring cash flow, while Mitsui Fudosan provides scale and international growth and Mitsubishi Estate delivers premium office leadership. For global investors, Sumitomo is attractive for defensive exposure, while peers may suit those seeking higher growth optionality.
8. Conclusion
Sumitomo Realty combines defensive stability from its Tokyo office leasing portfolio with measured growth through condominiums, renovations, and international expansion. Over the past three years, it has delivered consistent revenue and profit growth, improved capital structure, and steadily raised dividends.
From a valuation perspective:
P/E ~15.9x, aligned with peers.
P/B ~1.4x, reflecting both strong asset base and moderate return profile.
Dividend yield ~1.1%, below peers but with clear growth visibility.
The stock appears fairly valued at current levels. For long-term investors, Sumitomo Realty offers a balance of stability and growth, underpinned by Tokyo redevelopment projects and overseas expansion. While near-term upside is modest, the structural pipeline supports a Hold to Accumulate stance.
At Wasabi Info, we publish concise equity reports and market insights through our blog, and also provide custom, tailor-made research to support strategic decision-making for both private investors and corporations.
Our research services include:
• Equities: In-depth analysis of Japan-listed companies not featured in the blog
• Competitor Analysis: Detailed mapping of industry rivals and market dynamics
• Market Entry Intelligence: Insights into local barriers, regulations, and competitor positioning
• Real Estate & Assets: Localized assessments for factory, hotel, or retail expansion
• Field Intelligence: On-the-ground surveys and discreet market checks unavailable through public sources
Reports are available in English, Chinese, and Japanese.
For inquiries, please contact: admin@wasabi-info.com
© Wasabi Info | Privacy Policy
Disclaimer
This report is provided for informational purposes only and does not constitute investment, legal, or tax advice.
The analysis may include forward-looking statements and interpretations based on publicly available information as of the date of writing.
Readers are solely responsible for their own investment decisions and should seek advice from a licensed financial advisor or other qualified professional.
Wasabi-Info.com makes no representation or warranty, express or implied, regarding the accuracy, completeness, or reliability of the information contained herein, and shall not be held liable for any loss or damage arising from the use of this report.