
Equity Analysis: ANA Holdings Inc. (TSE: 9202)
As of August 1, 2025
1. Introduction
ANA Holdings Inc. is Japan’s largest airline group, operating a diverse aviation portfolio that includes the full-service All Nippon Airways (ANA), low-cost carriers (Peach and AirJapan), cargo, maintenance, trading, and other businesses. Headquartered in Tokyo, ANA has become a vital part of Japan’s transportation infrastructure and a key player in the Asia-Pacific aviation sector.
The company suffered significant headwinds during the COVID-19 pandemic but has made a strong recovery, supported by robust cost-cutting, strategic restructuring, and a resurgence in international travel.
2. Stock Price Development
Over the past five years, ANA Holdings’ stock has experienced significant volatility, reflecting the impact of the COVID-19 crisis, the subsequent recovery in global air travel, and shifting investor expectations. The price trajectory can be segmented into five distinct phases:
| Period | Trend | Key Drivers |
|---|---|---|
| 2020 (Q1–Q3) | Sharp Decline | COVID-19 shock, grounded international traffic, collapse in demand |
| 2021 | Range-Bound Recovery | Gradual domestic reopening, capital raising, weak international outlook |
| 2022 | Moderate Uptrend | Border reopening, improved cargo profits, investor optimism returns |
| 2023 (H1–H2) | Acceleration & Rally | International recovery, strong earnings, cost discipline |
| 2024–2025 | Sideways with Volatility | Mixed earnings, fuel cost pressures, concerns over global economic slowdown |
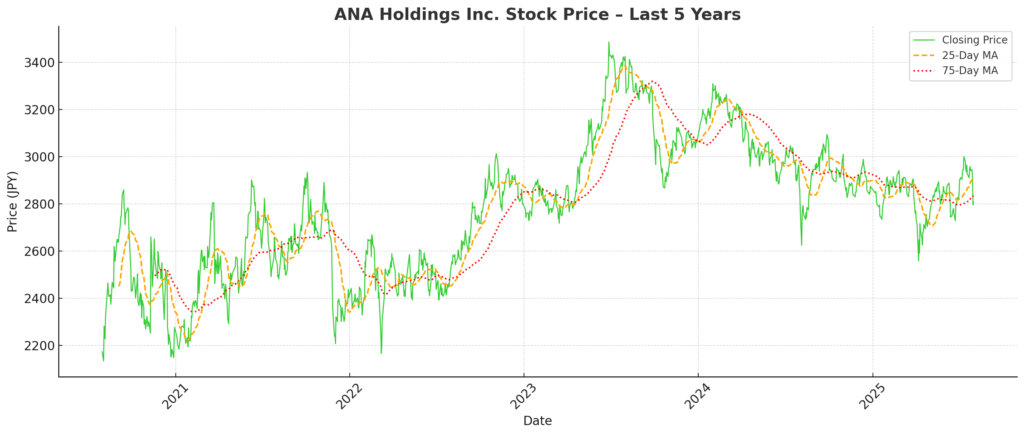
Stock Chart Trends (from 5-Year Chart with MAs)
Bullish Momentum (2022–2023):
The 25-day moving average (MA) consistently crossed above the 75-day MA during mid-2022 and again in early-to-mid 2023, signaling upward momentum supported by border reopening and rising international passenger traffic.Sideways Consolidation (2024–2025):
Since early 2024, the stock has exhibited a range-bound pattern, oscillating between approximately ¥2,650 and ¥3,000. This reflects a transition from recovery optimism to cautious wait-and-see positioning by investors.Key Technical Levels:
Recent Support Zone: ¥2,600–2,700
Recent Resistance Zone: ¥2,950–3,000
3. Financial and Operational Analysis
3.1 Key Financial Metrics (FY2021–FY2025, Consolidated)
| Fiscal Year End | Revenue (¥ Bn) | Operating Profit (¥ Bn) | Net Profit (¥ Bn) | EPS (¥) | Dividend (¥) |
|---|---|---|---|---|---|
| 2021/3 (FY2020) | 728.7 | –464.7 | –404.6 | –1,082.04 | 0 |
| 2022/3 (FY2021) | 1,020.3 | –173.1 | –143.6 | –305.37 | 0 |
| 2023/3 (FY2022) | 1,707.5 | 120.0 | 89.5 | 190.24 | 0 |
| 2024/3 (FY2023) | 2,055.9 | 207.9 | 157.1 | 335.09 | 50.00 |
| 2025/3 (FY2024) | 2,261.9 | 196.6 | 153.0 | 325.58 | 60.00 |
3.2 Observations and Trends
Revenue Recovery Post-COVID: Revenue nearly tripled from ¥728.7 billion in FY2020 to ¥2,261.9 billion in FY2024, reflecting a robust rebound in domestic and international air travel.
Profitability Swing: The company turned operating profit positive in FY2022, with peak operating income of ¥207.9 billion in FY2023. A slight decline to ¥196.6 billion in FY2024 suggests normalization as pent-up travel demand tapered.
Net Profit Surge: ANA recorded a net profit of over ¥150 billion in both FY2023 and FY2024—an impressive turnaround from deep losses during the pandemic.
EPS and Dividends: Earnings per share (EPS) and dividends recovered in tandem, with dividend reinstated at ¥50 in FY2023 and increased to ¥60 in FY2024.
Cost Efficiency and Margin: The increase in operating profit in FY2023 outpaced revenue growth, implying margin improvements likely due to operational leverage and cost restructuring.
FY2024 Plateau: While strong, the slight decline in operating profit despite higher revenues suggests rising costs (fuel, labor) or yield pressures.
4. Strategic and Technological Positioning
4.1 Post-COVID Recovery and International Strategy
Pivot to Profitability: ANA shifted focus from survival to growth as international demand returned. While domestic traffic recovered early, ANA began aggressively restoring long-haul international routes from FY2023 onward, particularly to North America, Europe, and Southeast Asia.
International Passenger Business Expansion:
FY2024 saw a 47% YoY increase in international passenger revenue, with load factors approaching pre-COVID levels.
ANA continued optimizing its dual-brand model (ANA and Peach) to segment demand efficiently—ANA focusing on premium long-haul, Peach targeting short-haul leisure.
Fleet Restoration: ANA brought grounded wide-body aircraft (Boeing 777/787) back into service as international routes were reactivated. Strategic redeployment allowed for cost-effective ramp-up while avoiding new aircraft purchases in a high-inflation environment.
Cargo Diversification: Even as global air cargo softened post-pandemic, ANA’s cargo revenue in FY2024 remained nearly double pre-COVID levels, supported by dedicated freighter operations and high-value logistics.
Geopolitical Navigation: The company rerouted certain Europe-bound flights to avoid Russian airspace, increasing fuel costs but maintaining service continuity—demonstrating adaptability in volatile global conditions.
4.2 Digital Transformation and Fleet Strategy
Digital Shift in Customer Experience:
Expanded use of biometric authentication and touchless check-in systems at major hubs (Haneda, Narita).
Advanced AI-based dynamic pricing and CRM personalization supported revenue management and loyalty retention.
Operational Efficiency via Data:
ANA utilized predictive analytics for maintenance scheduling and fuel optimization, contributing to lower CASK (Cost per Available Seat Kilometer).
IT investments focused on cloud-native infrastructure to improve agility and integrate Peach systems.
Sustainability and Fleet Modernization:
ANA committed to achieving net zero CO₂ emissions by 2050, with interim targets in FY2030.
Introduction of more fuel-efficient aircraft (e.g., Boeing 787-10, Airbus A320neo) and use of SAF (Sustainable Aviation Fuel) are key levers.
ANA is participating in Japan’s SAF supply chain development alongside oil majors and policymakers.
Green Bond Utilization: ANA has issued green bonds earmarked for ESG-aligned aircraft and decarbonization technologies, signaling commitment to sustainable finance.
5. Risks and Catalysts
5.1 Catalysts
| Catalyst | Description | Timeline |
|---|---|---|
| Recovery in Japan Inbound Tourism | Government visa easing and rising yen-based affordability are boosting inbound demand, especially from Southeast Asia and North America. ANA’s Tokyo hub strategy positions it to capture high-value inbound traffic. | Short-Term |
| Sustainable Aviation and Green Finance | ANA’s leadership in SAF (Sustainable Aviation Fuel) and ESG-aligned financing (e.g., green bonds) could attract ESG-focused investors and secure long-term capital. | Mid-Term |
| Digital Monetization and AI | Expansion of data-driven ancillary revenue (dynamic pricing, cross-selling, personalized promotions) supports margin expansion without fleet growth. | Mid-Term |
| Resumption of Corporate Travel | Although slower to recover than leisure, high-margin business travel is showing signs of sustained return, especially for trans-Pacific routes. | Mid-Term |
| Japan–U.S. Open Skies Leverage | ANA benefits from favorable bilateral agreements and Star Alliance partnerships, helping grow profitable U.S.-Japan routes. | Structural |
5.2 Risks
| Risk | Description | Timeline |
|---|---|---|
| Fuel Price Volatility | With jet fuel accounting for ~20–30% of total costs, sharp price increases—especially amid geopolitical instability—could pressure margins. Hedging provides partial relief but not full protection. | Short-Term |
| Labor Cost Inflation | Wage hikes and pilot shortages in global aviation could elevate fixed costs, particularly if competitors in Asia offer higher compensation. | Short to Mid-Term |
| Yield Compression from LCC Competition | Price-sensitive travelers are increasingly shifting to low-cost carriers, including Peach. Overcapacity in certain routes may reduce ANA’s pricing power. | Mid-Term |
| Geopolitical Route Disruptions | The need to avoid certain airspaces (e.g., Russia) increases fuel burn and scheduling complexity for Europe-bound routes. | Mid-Term |
| SAF Supply Chain Constraints | ANA’s decarbonization strategy hinges on SAF availability. Japan’s SAF ecosystem is still underdeveloped, posing regulatory and cost risks. | Structural |
6. Conclusion
ANA Holdings has undergone a remarkable financial turnaround since the COVID-19 pandemic, transforming record losses into sustained profitability. Over the past five years, the company has rebuilt its balance sheet, restored key international routes, and resumed dividends—signaling normalized operations and strategic clarity.
From an operational standpoint, ANA remains a leader in Japan’s full-service aviation market, with competitive advantages stemming from its Tokyo hub dominance, strong corporate travel network, and dual-brand model with Peach Aviation. Its digital transformation efforts, ESG commitments, and prudent cost management further reinforce its long-term positioning.
However, from a valuation perspective, the current share price of approximately ¥2,800 (as of July–August 2025) suggests that much of the post-COVID recovery has already been priced in:
The FY2024 Price-to-Earnings Ratio (PER) stands at ~8.6x, which is below long-term averages for global full-service carriers.
Total Shareholder Return (TSR) for FY2024 was +8.5%, in line with market benchmarks.
While earnings have stabilized, operating profit has already peaked in FY2023 at ¥207.9 billion, and declined to ¥196.6 billion in FY2024—implying that the strongest rebound phase may be behind us.
ANA is entering a phase where future gains will rely on structural improvements (e.g., sustainable aviation fuel scaling, international yield control, and premium customer retention), rather than one-time demand surges.
In this context, ANA stock may offer moderate upside potential for long-term investors who value stability, ESG orientation, and exposure to inbound tourism tailwinds. That said, near-term catalysts are limited, and investors should weigh inflationary risks and geopolitical uncertainties in their outlook.
At Wasabi Info, we publish concise equity reports and market insights through our blog—
but our core value lies in providing bespoke, on-demand research for international clients.
Whether you are a private investor or a corporation, we deliver confidential, tailored intelligence designed to support strategic decisions.
Our research services include:
• Equities: In-depth analysis of Japan-listed companies not featured in the blog
• Competitor Analysis: Detailed mapping of industry rivals and market dynamics
• Market Entry Intelligence: Insights into local barriers, regulations, and competitor positioning
• Real Estate & Assets: Localized assessments for factory, hotel, or retail expansion
• Field Intelligence: On-the-ground surveys and discreet market checks unavailable through public sources
Reports are available in English, Chinese, and Japanese.
For inquiries, please contact: admin@wasabi-info.com
© Wasabi Info | Privacy Policy
Disclaimer
This report is intended for informational purposes only and does not constitute investment advice. The analysis contains forward-looking statements and interpretations based on publicly available information as of the date of writing. Readers should conduct their own research and consult with a licensed financial advisor before making any investment decisions.
Wasabi-Info.com shall not be held liable for any loss or damage arising from the use of this report or reliance on its contents.